
Understanding the current state of NASCAR television ratings demands a sophisticated blend of statistical comprehension and astute critical thinking, as a recent report from sportsamo.com highlights the significant changes underway. The sport, like much of the entertainment industry, is grappling with a paradigm shift in how audience shares are measured, ushered in by Nielsen Media Research’s innovative "Big Data + Panel" metric. This new methodology has become a focal point of discussion within NASCAR circles, fundamentally altering how success is quantified and perceived.
For the better part of the 21st century, Nielsen’s primary method for gauging television audiences relied on a singular tool: people meters placed within household panels. This traditional model provided a foundational understanding of viewership, but its limitations in an increasingly fragmented media landscape became apparent. The "Panel" approach involved approximately 42,000 households and over 100,000 individuals, using either manual viewing journals or electronic devices that required viewers to register their presence and demographics. This system allowed Nielsen to project, with a reasonable degree of accuracy, the age, gender, income, and ethnicity of viewers for every quarter-hour of programming. For instance, if a hundred males from the coveted 18-34 demographic were watching a specific program within the sample, the working assumption was that a quarter-million such individuals were tuned in nationally. While robust for its time, this projection-based model inherently carried a margin of error due to its reliance on a sample size, no matter how carefully curated.
However, the media consumption habits of the nation have evolved dramatically, necessitating a more comprehensive measurement system. Enter "Big Data + Panel," which Nielsen officially adopted in September 2025. This hybrid model integrates the time-honored panel measurements with an unprecedented volume of data gleaned from digital sources. "Big Data" refers to the vast trove of information collected from cable and satellite set-top boxes (from providers like Comcast, DirecTV, and Dish Network) and, crucially, from internet-connected smart televisions manufactured by giants such as Roku, Vizio, LG, and Samsung.
The data captured by these sources offers distinct insights. Cable boxes utilize "Return Path Data," which logs what channel is being watched, when channels are changed, and the duration of viewership. This data is precise about the channel but doesn’t discern the actual content being displayed. Smart TVs, on the other hand, employ "Automatic Content Recognition" (ACR), which actively monitors the images and sounds on the screen to identify the exact program being viewed. The critical distinction here is that while "Panel" data traditionally knew who was watching (via demographic input), "Big Data" knows what is on the television but cannot confirm if a human being is actively engaged with the content. This fundamental difference creates a complex challenge for accurate measurement.
To reconcile these disparate data streams, Nielsen employs sophisticated Artificial Intelligence. This AI is tasked with smoothing out discrepancies between the "Panel" and "Big Data" metrics, leveraging over 75 years of demographic probabilities derived from Panel-only readings. The AI makes probabilistic adjustments based on a multitude of factors, including historical viewing patterns associated with a specific device, the day of the week, demographic profiles of a ZIP code, and even prevailing weather conditions. Despite this advanced algorithmic approach, the system remains imperfect. A significant hurdle lies in the fact that "Big Data" cannot definitively identify who is watching, leading to assumptions. For example, if a household’s smart TVs are simultaneously playing a NASCAR race, an NFL game, and "American Idol," the AI must infer, based on its demographic probabilities, which individual or group is likely watching each program. This inherent assumption, while informed, introduces a layer of estimation that can significantly impact the final tallies.
Further complicating the picture are the demographic biases inherent in each "Big Data" source. Cable boxes tend to over-represent an older demographic, while smart TVs often skew towards younger viewers. Given that NASCAR has historically commanded an older demographic, these inferences can subtly, yet significantly, influence weekly viewership totals. This dynamic was notably observed this past spring, where NASCAR was perceived to be disadvantaged by "Big Data" on traditional linear platforms like FOX and FS1, but conversely benefited when airing on a streaming-exclusive platform like Prime Video. It’s crucial to note that the full "Big Data + Panel" methodology wasn’t implemented until September, rendering direct year-over-year comparisons between the old and new metrics somewhat unreliable. NASCAR’s measured pushback on such comparisons until the data fully aligns in September is, therefore, a fair and strategically sound position.
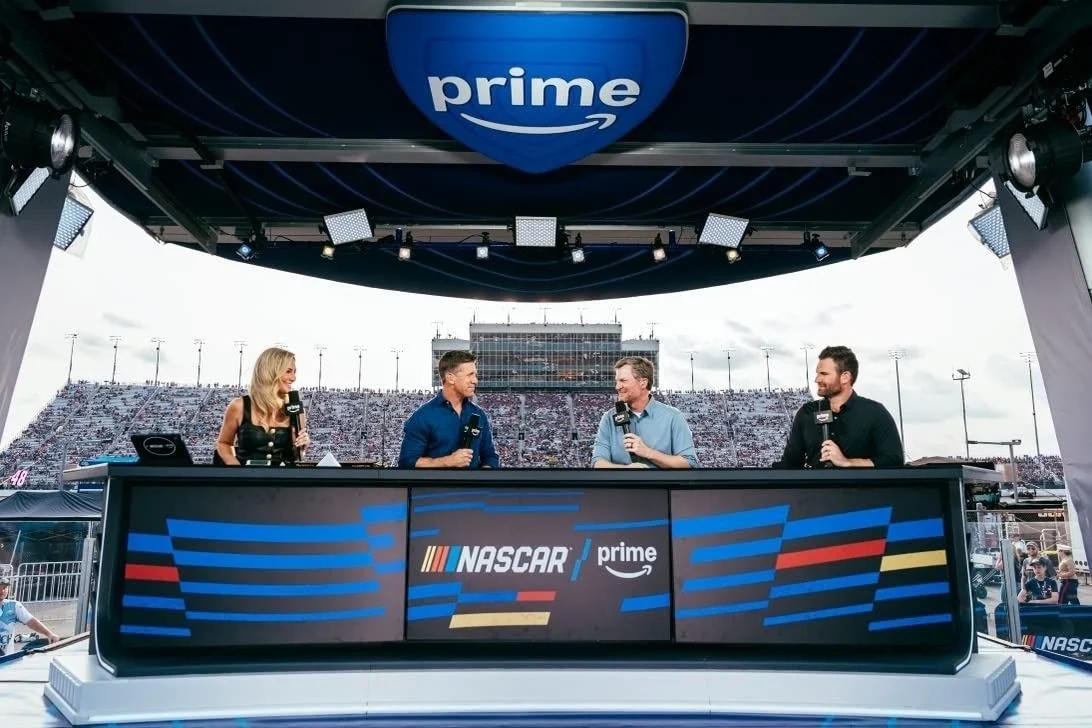
This brings us to the recent NASCAR Cup Series and Xfinity Series races at Nashville Superspeedway, providing an early glimpse into the impact of this new measurement era. The Cup Series race, broadcast on Prime Video, registered 2.01 million viewers according to the "Panel + Big Data" metric. This figure represents a mere three percent decrease from the previous year’s event. Critically, this comparison must account for the fact that the 2026 race (likely a typo in the original, intended as 2023 or the prior year’s event for comparison) experienced a significant delay of nearly 90 minutes due to rain. Such delays often fragment viewership and can depress overall numbers, making the modest 3% dip a potentially encouraging sign for Prime Video.
Prime Video also released additional statistics, most notably a median age of 57.1 for its NASCAR audience. This is a remarkable six years younger than the 63.1 average age recorded for NASCAR viewership on linear television this year. This demographic shift is a major win for NASCAR, which has long sought to attract a younger audience to ensure the sport’s long-term vitality. The move to streaming platforms like Prime Video is a deliberate strategy to tap into a demographic more accustomed to digital consumption, and these initial numbers suggest it’s beginning to pay dividends. When measured by the "Panel only" metric, the Nashville Cup race garnered 1.665 million viewers, a 12 percent decline from the 1.9 million viewers who tuned in last year when the race ran on schedule. This highlights the disparity between the two measurement methods and underscores the challenge of comparing apples to oranges in this transitional period.
Turning to the Xfinity Series, broadcast on The CW, the results paint an even more positive picture. Utilizing the "Panel only" metric, which offers the most accurate year-over-year comparison pre-September, the Saturday race at Nashville Superspeedway attracted 1.123 million viewers. This represents a robust 14 percent increase compared to the same race on the same weekend and network last year. Viewership for the Xfinity race peaked impressively at 1,335,000 total viewers during the 9:15-9:30 p.m. ET quarter-hour.
When the "Big Data + Panel" metric is applied, the Xfinity race recorded 1.119 million viewers. The CW proudly announced that this figure signifies a 13 percent increase from the previous year on the same weekend, track, and network, making it the most-watched Xfinity Series race at Nashville in six years. Peak viewership using the "Big Data + Panel" metric reached 1,292,000 during the identical 9:15-9:30 p.m. ET quarter-hour. The consistent growth across both metrics for the Xfinity Series on The CW is a testament to the network’s growing presence in sports broadcasting and NASCAR’s appeal to a broader audience. The CW, a network traditionally known for its youth-oriented entertainment, is strategically expanding into live sports, and NASCAR appears to be a beneficial partner in this endeavor.
The implications of these shifts are profound for NASCAR and the broader sports media landscape. The "Big Data + Panel" system, despite its initial complexities and the need for careful interpretation, represents a more holistic and potentially accurate reflection of modern viewership. It accounts for the vast number of eyeballs on smart TVs and through streaming services, which traditional panel-based methods could not fully capture. While the Cup Series on Prime Video saw a slight dip in overall numbers, the significantly younger median age is a strategic victory, indicating successful demographic targeting and the potential for long-term audience growth. For the Xfinity Series on The CW, the strong double-digit percentage increases are unequivocally positive, showcasing the series’ health and the effectiveness of its broadcast partnership.
As NASCAR continues its journey through this evolving media environment, the ability to adapt to new measurement standards and leverage diverse broadcast platforms will be paramount. The move to streaming partners like Prime Video and the embrace of networks like The CW are not merely about securing broadcast rights; they are strategic maneuvers to broaden reach, engage new demographics, and future-proof the sport in an age where traditional television viewing is steadily declining. The coming months, particularly after September when year-over-year comparisons become truly apples-to-apples under the new Nielsen methodology, will offer even clearer insights into the success of these bold initiatives and the true impact of the "Big Data + Panel" era on America’s premier stock car racing series.